Introduction
Floods threaten lives, livelihoods, and infrastructure in many regions of Africa. The continent has been repeatedly ravaged by floods during the past decades, with significant consequences for vulnerable populations. For example, cyclones Idai and Kenneth led to heavy flooding and loss of life in Southern Africa in 2019. This year, cyclones and floods have also affected many parts of Southern Africa.
Reliable estimates of the magnitude and frequency of floods are essential for planning and managing floodplain and river infrastructure. Furthermore, flood frequency analysis is critical for developing flooding mitigation strategies. Policymakers and decision-makers require accurate flood frequency maps and information for effective regional and national flood risk management programs. Therefore, hydrologists and remote sensing experts should create reliable and consistent flood frequency maps to implement effective flood risk management programs.
The Challenges of Historical Flood Frequency Analysis
There is a lack of systematic flood risk information to inform emergency planning in many countries in Africa. While experts have implemented case-study models for flood monitoring, accurate historical and current information on flood hazard events is severely limited. The lack of flood risk information is due to inadequate input data such as hydro-meteorological and digital elevation data in many countries. Therefore, experts have used global-scale flood datasets such as the MODIS Global Flood Database and the Joint Research Centre (JRC) Global Surface Water dataset to map flood frequency.
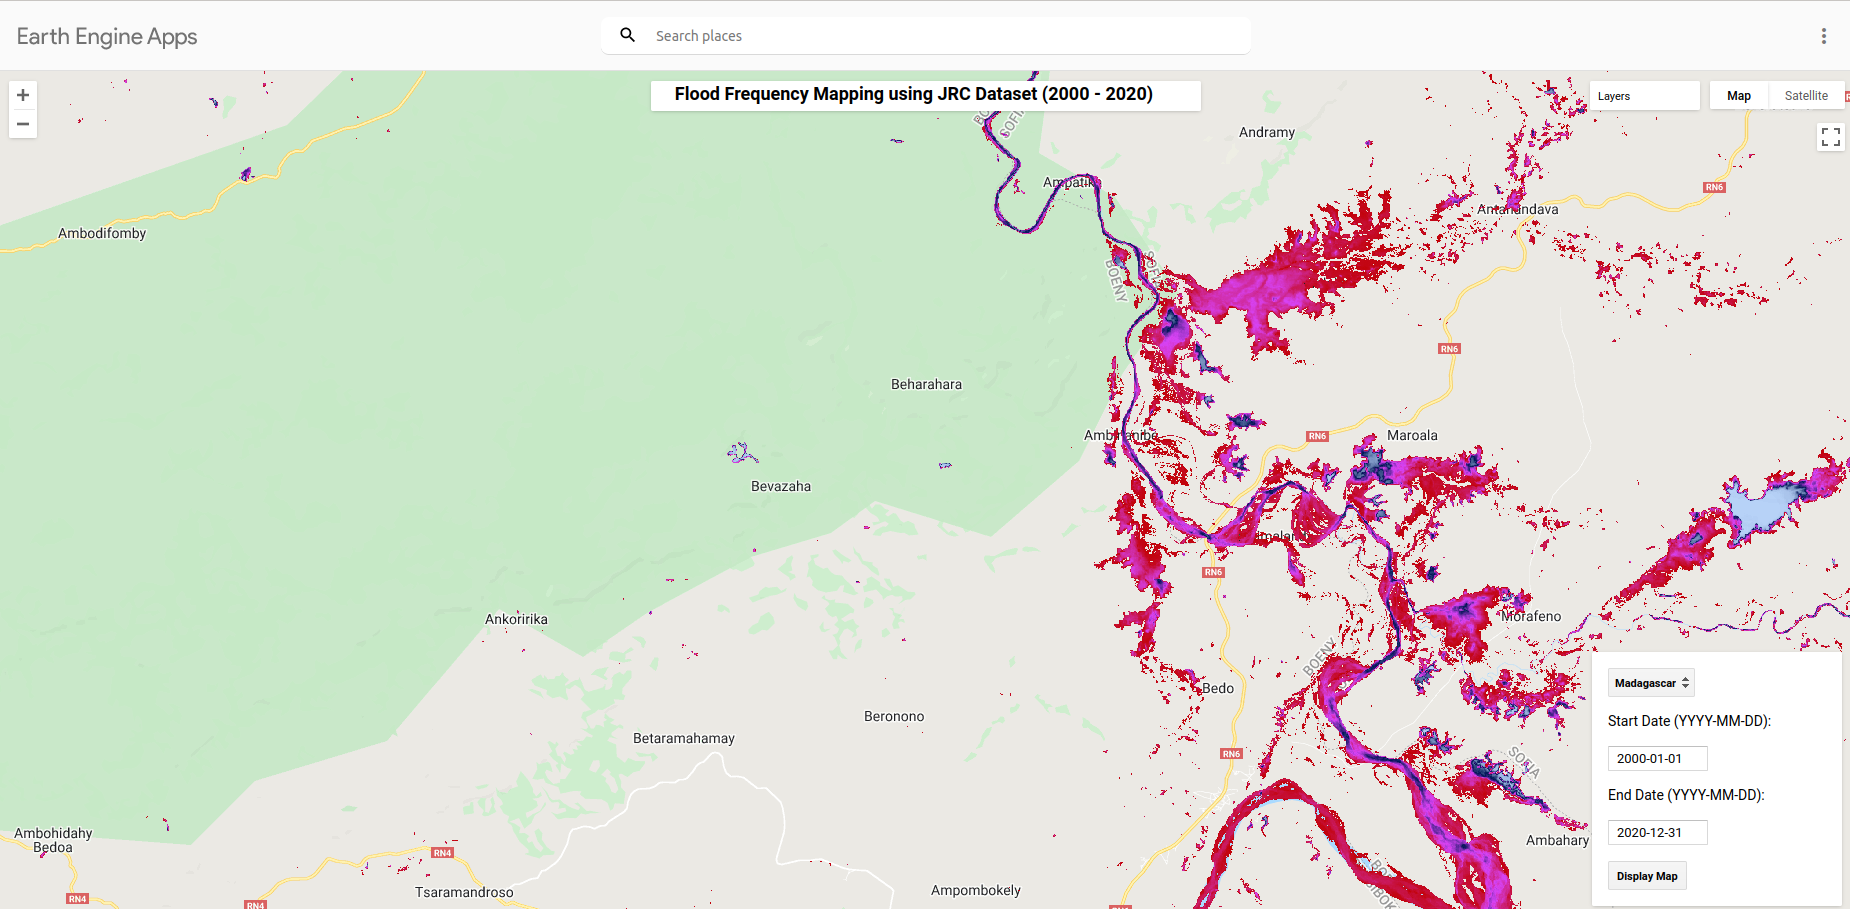
The JRC Global Surface Water dataset facilitates the analysis of surface water locations and temporal distribution (from 1984 to 2020). In addition, the dataset provides statistics on the extent and change of water surfaces. However, global-scale flood datasets derived from satellite data have a coarse spatial resolution, making validation extremely challenging. It is noteworthy that these datasets have been helpful, particularly in data-sparse regions.
Opportunities: Use of EO Data and Participatory Mapping
Flood risk assessment requires critical information on flood events, frequency, magnitude, and population exposure to flood hazards. To date, much progress has been made to map and monitor flooding. The development of Earth Observation (EO) systems with increased temporal and higher spatial resolution, such as Synthetic Aperture Radar (SAR), is helpful for flood mapping.
SAR data such as Sentinel-1 provide frequent observations due to its capability to map flooded areas in cloudy weather conditions. Furthermore, remote sensing experts can use the combination of SAR and optical data (e.g., Sentinel-2 and Landsat-8) and existing global flood datasets (e.g., JRC Global Flood Database) to create helpful flood analysis tools. Although the lack of local ground data is a significant drawback, experts can use participatory mapping to collect beneficial flood information. Participatory mapping uses local knowledge and expertise to delineate flood-affected extent. More importantly, the participatory mapping will involve the participation of local communities that have experienced flooding firsthand.
Next Steps
There is an urgent need to develop user-friendly tools and create reliable and consistent flood information at local and national scales. Despite various past and ongoing efforts to improve flood information, many countries remain vulnerable to extreme flood events. Therefore, experts, policymakers, and local communities should use existing flood frequency information, prepare flood maps at a fine spatial scale (i.e., 10m), and model flood risk. Last but not least, disaster agencies should have a web portal for distributing flood information.
This blog post will use the JRC Global Surface Water dataset (2000–2020) and Google Earth Engine (GEE) to map water occurrence and flood frequency in selected Southern African countries. Readers can access the GEE app and script.