Introduction
Pixel-based image classification methods are widely used to map land cover. Thanks to decades of pixel-based image classification research and the availability of free Earth Observation (EO) data. In pixel-based image classification, each pixel is assigned to a particular land cover class (e.g., built-up, woodlands, water). Each pixel represents an n-dimensional vector, where n is the number of spectral bands. Generally, most pixel-based classification algorithms assume that each pixel contains spectral information, representing homogeneous land cover classes. In reality, this is not true. Pixel-based image classification methods have many limitations, especially in urban land cover mapping.
The Challenges!!
Following are some of the challenges and limitations. First, built-up areas (rooftops, pavements, and roads) appear identical to fallow cropland and bare areas in sparse urban or peri-urban areas. In some urban areas, buildings are constructed using the same materials found in the surrounding areas. This results in low object-to-background contrast. As a result, the spectral reflectance of built-up areas is similar to fallow cropland and bare areas. Second, mixed pixels reduce land cover mapping accuracy. This means that a pixel may contain different spectral signals from multiple surface features. For example, a Landsat 8 image pixel (30 m spatial resolution) may contain buildings, pavements, bare areas, and lawn features. Therefore, the pixel value represents an average of several spectral classes within that ground area (900 m2).
The Opportunities!!
Despite these challenges, pixel-based image classification methods are still useful. The availability of free Sentinel-1 (S1) and Sentinel-2 (S2) imagery provides an excellent opportunity to address some key challenges. This is because both S1 and S2 imagery have high spatial and temporal resolutions. Therefore, S2 spectral-temporal and S1 polarization features can improve urban land cover mapping. In addition, sub-pixel and object-based methods improve urban land cover mapping. For example, sub-pixel and fuzzy classification methods can reduce mixed pixel problems. Sub-pixel methods identify the proportions of different land cover classes in a pixel, while fuzzy methods assume that a pixel belongs to more than one land cover class. Furthermore, recent developments in semantic and instance-based segmentation are promising for classifying very high-resolution (VHR) imagery.
Mapping urban Landscapes
We focus on input data (EO and ancillary data) and classification algorithms in this blog post series (Urban Landscapes). These two factors can significantly improve land cover classification accuracy. In this blog post, we will explore pixel-based image classification using seasonal S2 imagery. I compiled S2 imagery for the rainy (January – March), post-rainy (April – June), and dry (July – August) seasons. We will explore land cover mapping challenges in Bulawayo, the second-largest city in Zimbabwe. We will also use the interactive web Earth Engine app to examine the classification errors. The app consists of a seasonal S2 true-color image (bands 4, 3, 2), color infrared image (bands 8, 4, 3), vegetation (bands 12, 11, 4), and land cover map. I used seasonal S2 imagery and a random forest model to map land cover in Earth Engine (link here).
Rainy Season Land Cover Map
The built-up areas in dense urban areas are relatively easy to identify. However, separating grass/ open and cropland areas from built-up areas in sparse and peri-urban areas is difficult. In addition, grass/ open areas are misclassified as built-up areas in the north-eastern part of the test site. Woodlands, cropland, grass/ open areas are spectrally similar in the rainy season S2 imagery. You can click the “Rainy Season App” link below to visualize the rainy season S2 imagery and corresponding land cover on the interactive web Earth Engine app.
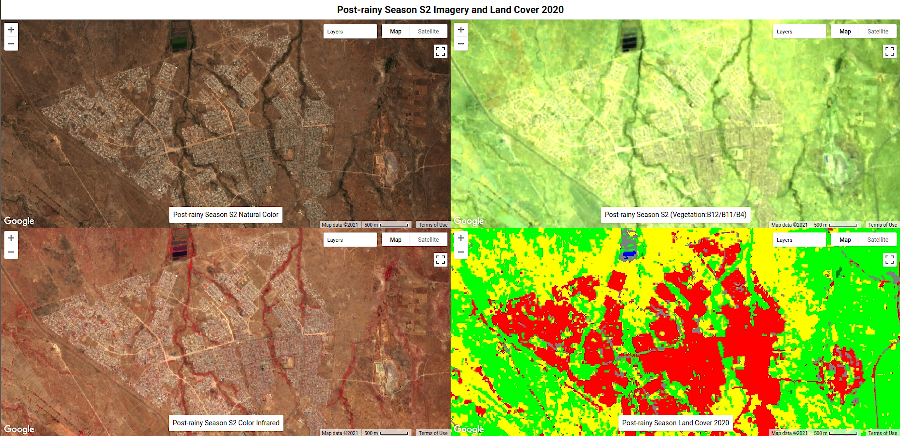
Post-rainy Season Land Cover Map
Woodlands are visible because trees are still leafed during the post-rainy season. It is also relatively easy to identify built-up areas in dense urban areas. However, it is challenging to separate grass/ open and cropland areas from built-up areas. For example, grass/ open areas are misclassified as built-up areas in the test site’s north-eastern, southern and south-eastern parts. In addition, built-up areas are overestimated. To visualize the post-rainy season S2 imagery and corresponding land cover in interactive mode, click the “Post-rainy Season App” link below.
Dry Season Land Cover Map
The built-up areas are also easy to identify in dense urban areas. However, it is more challenging to separate built-up areas from grass/ open and cropland areas in sparse and peri-urban areas. In general, built-up areas are overestimated in the dry season land cover map. Many misclassified built-up areas are found in the test site’s northeast, south, and southeast parts. To visualize the dry season S2 imagery and corresponding land cover in interactive mode, click the “Dry Season App” link below.
Next Steps
The interactive web Earth Engine app helps check pixel-based image classification errors. We observed land cover mapping problems in this blog post. However, we have only scratched the surface on pixel-based image classification. Below are some additional resources if you would like to learn more about pixel-based image classification:
• sign-up for our free courses at https://aigeolabs.com/; and
• download our Journal paper published in Geomatics (https://doi.org/10.3390/geomatics1010009).
I would love to hear your thoughts and questions about this post. So please do not hesitate to reach out. You can drop me an email at cou.kamusoko@aigeolabs.com or find me on Twitter at @CourageKamusoko. The next post in this series will cover the interpretation of RF models for pixel-based image classification.