Introduction
Clean water is essential to life. We all need water for drinking, sanitation, and the provision of food, energy, and health. Water is one of the critical United Nations (UN) Sustainable Development Goals (SDG6: Clean water and sanitation). However, water management is still challenging, given the past decades’ accelerated climate change and land-use intensification. According to the UN, millions of people -mostly children- die annually from water-borne diseases. Experts report that water scarcity and poor water quality negatively impact food security, livelihoods, and educational opportunities for marginalized people globally. Therefore, there is an urgent need to focus on water resource management to help address other SDGs such as food security, poverty alleviation, and public health.
Catchment areas are highly complex systems where biological, chemical, physical, ecological, and environmental factors influence the quality and quantity of water. In most low-income countries, the degradation of catchment areas has negatively impacted water quality. As a result, water pollution has increased due to point and nonpoint source pollution (from agricultural and urban areas) in catchment areas. Hydrologists and researchers need reliable monitoring practices to understand processes affecting water quality in catchment areas. Therefore, monitoring catchment areas is essential because it supports sound decision-making for water management authorities.
Monitoring Water Quality
Monitoring water quality requires a good understanding of climate, land use, and water resource dynamics at the catchment scale. Researchers generally measure water quality using parameters such as suspended sediments, turbidity, chlorophyll-a (Chl-a) concentrations, dissolved oxygen, nutrients, and harmful algae. Researchers note that nutrient enrichment, sediment influx, and dissolved oxygen depletion are characteristics of stressed water bodies. For example, suspended sediments are closely related to detrital matter and microorganisms that affect the biogeochemical processes. The spatial and temporal information on suspended sediments provides insights into the ecological status and water quality in a catchment area. This information is also critical for identifying critical pollutant sources and developing management plans.
Traditionally, researchers modeled water quality using in situ data obtained by collecting samples and analyzing them in a laboratory or onsite water quality monitoring stations. In most cases, only a few monitoring sites located at fixed points are available (which provide only discrete measurements in time and space). As a result, monitoring all water bodies in catchment areas is difficult due to the prohibitive cost and time required for in situ data collection. In addition, water management authorities in most low-income countries lack investment in monitoring stations and other hydrological infrastructure.
Advances in Cloud Computing and Earth Observation (EO) Technology
Recent advancements in cloud computing offer processing capabilities and free access to many EO data sets. Remote sensing researchers use cloud computing platforms such as Google Earth Engine (GEE), Digital Earth Africa (DEA), and Microsoft’s Planetary Computer to process and analyze EO data at national and regional levels or global scale. Water management authorities can use EO data to complement in situ water monitoring stations. While some EO systems have limitations and caveats in their use for water quality monitoring, medium to high spatial resolution satellite data sets such as Landsat or Sentinel-2 are freely available.
In recent decades, remote sensing researchers have used EO data to study water quality parameters such as suspended sediments, turbidity, and chlorophyll-a concentrations (Chl-a). For example, researchers have used satellite-derived indices such as the normalized difference suspended sediment index (NDSSI) and normalized difference turbidity Index (NDTI). It is important to note that the performance of these indices varies. Therefore, it is essential to understand how these indices perform for monitoring water quality in a specific catchment area.
Next Steps
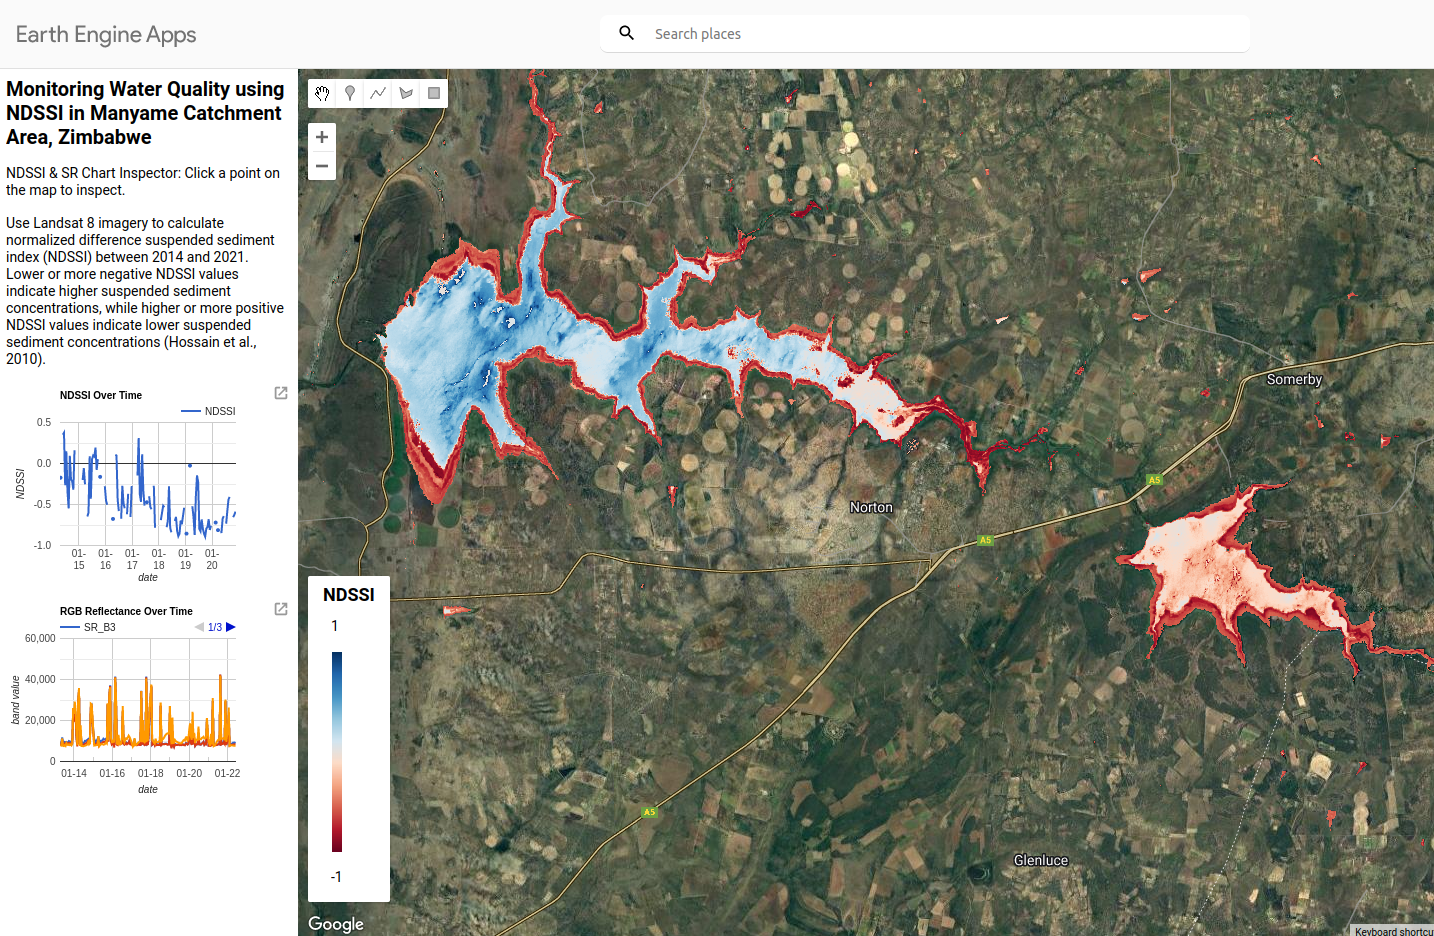
This blog tutorial will monitor water quality using the normalized difference suspended sediment index (NDSSI). We will use a time series of Landsat 8 Operational Land Imager (OLI) data in Earth Engine. We will use the Manyame catchment area in Zimbabwe as a test site. Readers can access the NDSSI app, tutorial, and GEE script at AI.Geolabs.