Introduction
Deforestation and forest degradation are significant sources of greenhouse gas emissions. During COP 26, many countries and corporations pledged to end deforestation by 2030. Therefore, governments need to map and monitor forest cover change to meet the COP26 deforestation pledges. In addition, countries will also need to identify forest areas with a high risk of future deforestation and characterize the drivers of deforestation. The nations will use the forest cover change information to mitigate and prevent carbon emissions that are likely to occur without sustainable forest management projects.
Forest monitoring systems
Timely mapping and monitoring forest cover change are vital to understanding the contribution of forests to carbon sequestration. Earth-observing (EO) systems provide data that remote sensing analysts use to map and monitor forest cover change and deforestation in inaccessible forest areas. Deforestation information derived from forest monitoring systems enables the government and communities to take timely actions against illegal and unsustainable forest activities. To date, most forest monitoring systems use near-daily coarse resolution MODIS (Moderate Resolution Imaging Spectroradiometer) sensor data. While the MODIS data provide good temporal coverage, it misses many small-scale forest cover losses due to their coarse spatial resolution. The combination of Sentinel-1 C-band SAR time series with Sentinel-2 and Landsat 8/9 data provides an opportunity to monitor deforestation timely using medium spatial resolution imagery.
Current Challenges in the Miombo Woodlands
The analysis of satellite imagery still poses many technical challenges in Miombo woodlands. For example, the woodland cover is generally sparse and lacks the solid red edge found in humid tropical forests due to ecological adaptations to the dry environment. Furthermore, seasonal phenological changes significantly vary the spectral appearance of woodland cover, while spectral confusion results in difficulty separating open woodlands and bushland. Given these challenges, remote sensing analysts need to apply robust data-centric machine learning techniques incorporating multi-sensor EO data (optical and radar), dense seasonal vegetation indices, and the Global Land Analysis and Discovery (GLAD) tree height data.
Purpose of the Blog Post
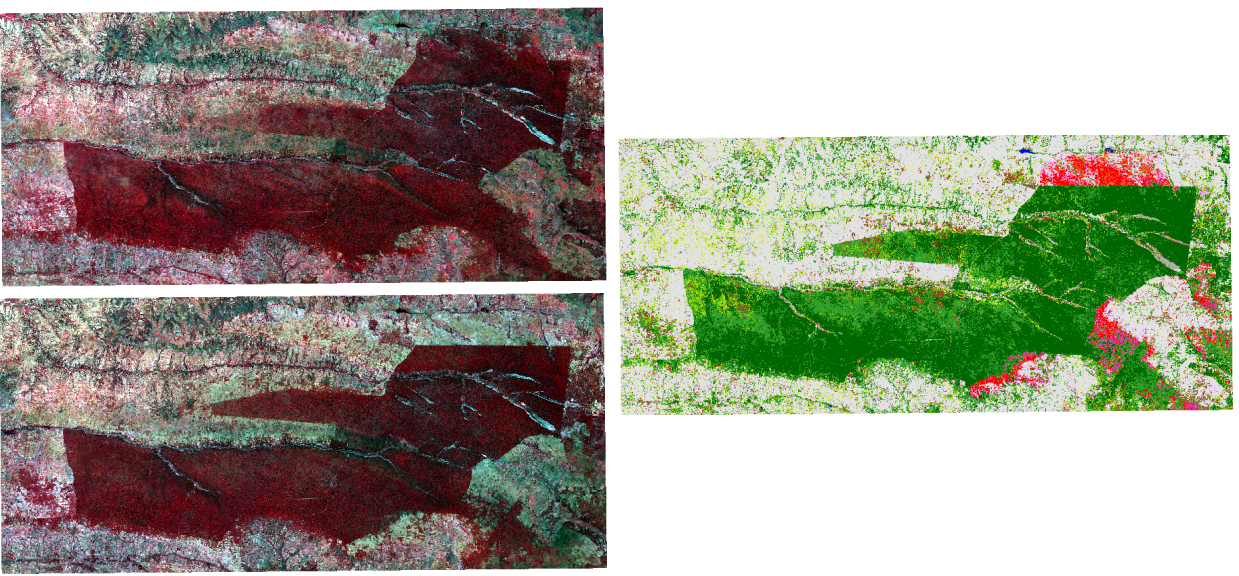
This blog tutorial will map and monitor annual deforestation between 2016 and 2021. We will use Sentinel-2 data and the random forest (RF) model.
Data and Procedure
In this post, we will use Mafungautsi Forest Reserve in Zimbabwe as a test site. Readers can access the blog tutorial and data in the links below.
Next Steps
I have prepared an introductory guide to perform explainable machine learning.

If you want to learn more about explainable machine learning, please download the guide for free at: