Introduction
In the era of big geospatial data, machine learning models with high complex algorithms are used to model forest canopy height and above-ground biomass (AGB). Remote sensing researchers and forestry experts use Earth Observation (EO) data and machine learning methods to model forest canopy height and AGB. Machine learning methods employ data-driven algorithms to build and estimate models.
Machine learning methods are beneficial in an exploratory or predictive task. However, it is not easy to understand how they make decisions for several reasons. First, machine learning models do not reveal how predictor variables vary with each other and the response variable. Second, most machine learning models focus on prediction accuracy (as a performance metric) but rarely explain their prediction in a meaningful way. The opaque nature of the machine learning algorithms limits the transparency and trust in these methods. Therefore, there is a need for easy-to-understand explainable machine learning methods.
LIME for Regression
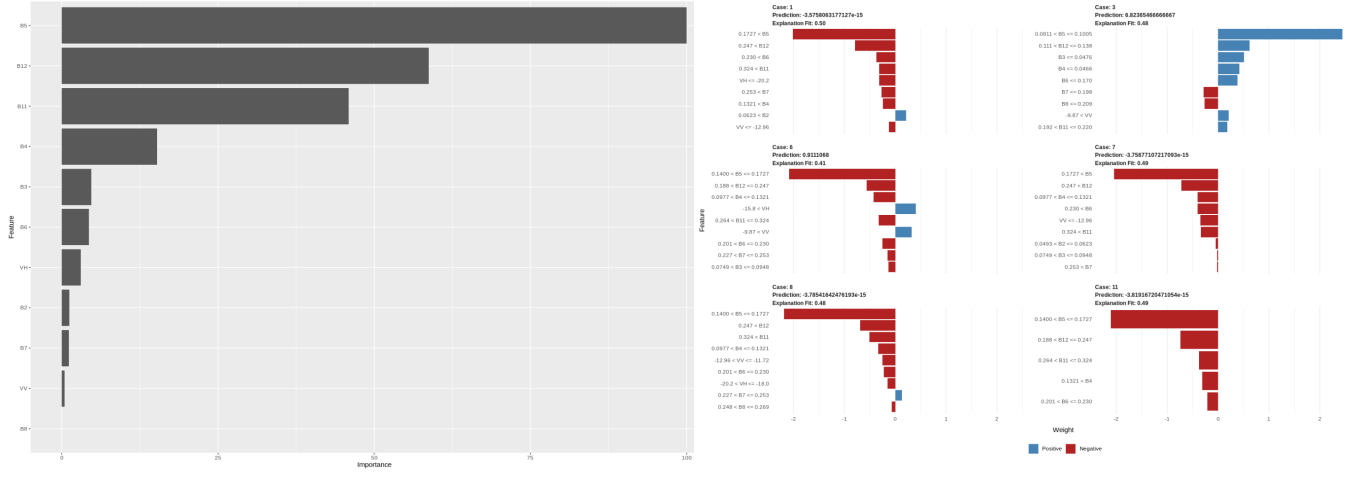
This post applies global and local model-agnostic methods to gain insights into the regression model performance (tree canopy height model). We use variable importance measures (global) to check how features in the data collectively affect the prediction. Then we use the Local Interpretable Model-agnostic Explanations (LIME) method to check how features individually affect the prediction.
LIME provides understandable insights for explaining the predictions by assigning a contribution value to each predictor variable: positive, negative, or zero. A positive contribution means that the predictor variable supports the prediction. In contrast, a negative contribution implies that the predictor variable is against the prediction. Zero means that the predictor variable does not influence the prediction. However, LIME can provide unreliable explanations. For example, very close points may have different explanations. Therefore, researchers should be careful when interpreting LIME results.
Data and Procedure
In this post, we will use Mafungautsi Forest Reserve in Zimbabwe as a test site. We will model forest canopy height using post-rainy season Sentinel-1 (S1), Sentinel-2 (S2), and elevation data. We will also use training data compiled from GEDI Level 3 (L3) gridded mean canopy height data (within a 1 km x 1 km grid). Readers can access the blog tutorial and data in the links below.
Next Steps
There are many resources to learn more about LIME. The links and resources below can help you to get started. You can also check my book in the link below to learn about other explainable machine learning methods.
Data-centric Explainable Machine Learning
Links and Resources
1. Marco Tulio Ribeiro, Sameer Singh, and Carlos Guestrin. 2016. “Why Should I Trust You?”: Explaining the Predictions of Any Classifier. In Proceedings of the 22nd ACM SIGKDD International Conference on Knowledge Discovery and Data Mining (KDD ’16). ACM, New York, NY, USA, 1135-1144. DOI: https://doi.org/10.1145/2939672.2939778
2. R package for LIME: https://github.com/thomasp85/lime
3. open-source Python code for LIME: https://github.com/marcotcr/lime