Introduction
Forest canopy height is critical for estimating above-ground biomass (AGB), carbon stock density, and forest habitat quality. Forest researchers and ecologists use forest canopy height to monitor ecosystem response to climate and land-use changes and biodiversity. Furthermore, forest canopy height is essential for assessing forest degradation and deforestation. Therefore, reliable and up-to-date information on forest canopy height and other attributes help the management of forest resources more effectively. Traditionally, forest researchers and ecologists used field measurements to collect forest canopy features. However, collecting forest canopy height information through ground measurements is time-consuming, costly, and often limited in spatial extent.
Earth observation (EO) Platforms
In the past decades, remote sensing researchers have used Earth observation (EO) data to map forest canopy height in forest areas. Ground, airborne and spaceborne platforms have been used to acquire oblique photographs, synthetic aperture radar (SAR), and light detection and ranging (LiDAR) or laser scanning data. Remote sensing analysts have used LiDAR to map forest canopy height. LiDAR is an active remote sensing sensor that captures the forest canopy’s three-dimensional structure. LiDAR encompasses different platforms such as terrestrial laser scanning (TLS), airborne laser scanning (ALS), drone LiDAR, and spaceborne LIDAR. While TLS and ALS provide more accurate forest canopy data, they are costly and have limited spatial and temporal coverage in large forest areas.
Spaceborne LiDAR
Spaceborne LiDAR and other satellite data are essential for repeat country to global scale wall-to-wall mapping of forest canopy height. In the past, remote sensing researchers used forest canopy height obtained from NASA’s Ice, Cloud, and Elevation Satellite (ICESat) to produce global biomass maps. However, NASA designed ICESat to acquire ice surface elevations. In addition, ICESat stopped collecting data in 2010. In 2018, NASA launched the Global Ecosystem Dynamics Investigation (GEDI) spaceborne LiDAR system on the International Space Station (ISS).
GEDI is a full waveform LIDAR designed to measure ecosystem structure and provides global coverage from 51.6° south to 51.6° north. It acquires forest vertical structure measurements in temperate and tropical forests. The LiDAR system consists of three lasers that produce eight parallel observation tracks. Each laser illuminates a 25-meter spot on the surface, where the 3D structure is measured. Every 25-meter site is separated by 60 meters along the track. There are about 600 meters between each of the eight tracks, and the system acquires data along these tracks. To date, GEDI is used to derive several footprints and gridded products, including canopy height, leaf area index (LAI), and biomass.
Modeling Forest Canopy Height
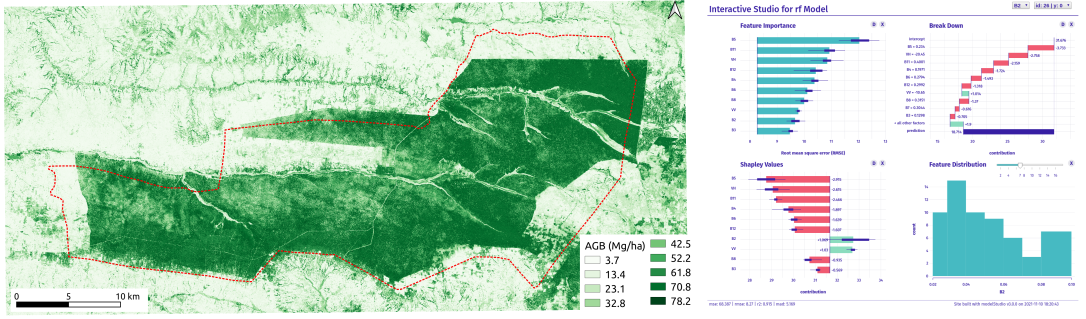
Remote sensing researchers and analysts have used the random forest (RF) model to estimate forest canopy height based on LiDAR-derived canopy height and optical and SAR data. The advantage of the RF model is that it can handle many numerical and categorical predictor variables and is free from normal distribution assumptions. However, it is not easy to interpret the RF model results, and often the model is biased in favor of predictor variables with many different levels of categories. Therefore, it is essential to use explainable machine learning to gain insights into the RF model.
Purpose of the Blog Post
This blog tutorial will model forest canopy height using forest canopy height derived from GEDI. We will use seasonal Sentinel-1 and Sentinel-2 data and elevation data as predictor variables in the RF model.
Data and Procedure
In this post, we will use Mafungautsi Forest Reserve in Zimbabwe as a test site. Readers can access the blog tutorial and data in the links below.
Next Steps
Please check my upcoming book on “Data-centric Explainable Machine Learning for Land Cover Classification: A Practical Guide in R.”

If you want to learn more about the upcoming book, please check the information at: