Introduction
Miombo woodlands are the largest dry forest ecosystems in central and southern Africa, covering approximately 2.7 million square kilometers. The woodlands have a large and complex variation in vegetation structure. Forestry experts classify the Miombo woodlands into old-growth, degraded or disturbed, and re-growth. Old-growth woodlands are relatively mature woodlands with little or no disturbance. Disturbed woodlands represent woodlands degraded by human activities (gathering of fuelwood, shifting cultivation, etc.) and natural causes (such as fires). Re-growth woodlands represent naturally regenerating woodlands after the clearing of mature woodlands. Although the Miombo woodlands store significant carbon, the woodlands’ canopy structure and carbon stocks are poorly understood.
Spaceborne LiDAR for Modeling Forest Canopy Height
Remote sensing researchers have successfully used terrestrial laser scanning (TLS) and airborne laser scanning (ALS) to estimate AGB. However, large-scale assessment of AGB with TLS and ALS remains challenging due to cost, especially in tropical rainy and dry forest ecosystems. Therefore, spaceborne LiDAR systems such as NASA’s Global Ecosystem Dynamics Investigation (GEDI) mission present a viable option to acquire 3D forest structure data at a footprint resolution of 25 m.
Purpose of the Blog Post
The previous blog modeled forest canopy height using post-rainy season Sentinel-1, Sentinel-2, and elevation data. We used the training data compiled from GEDI Level 3 (L3) gridded mean canopy height data (within a 1 km x 1 km grid).
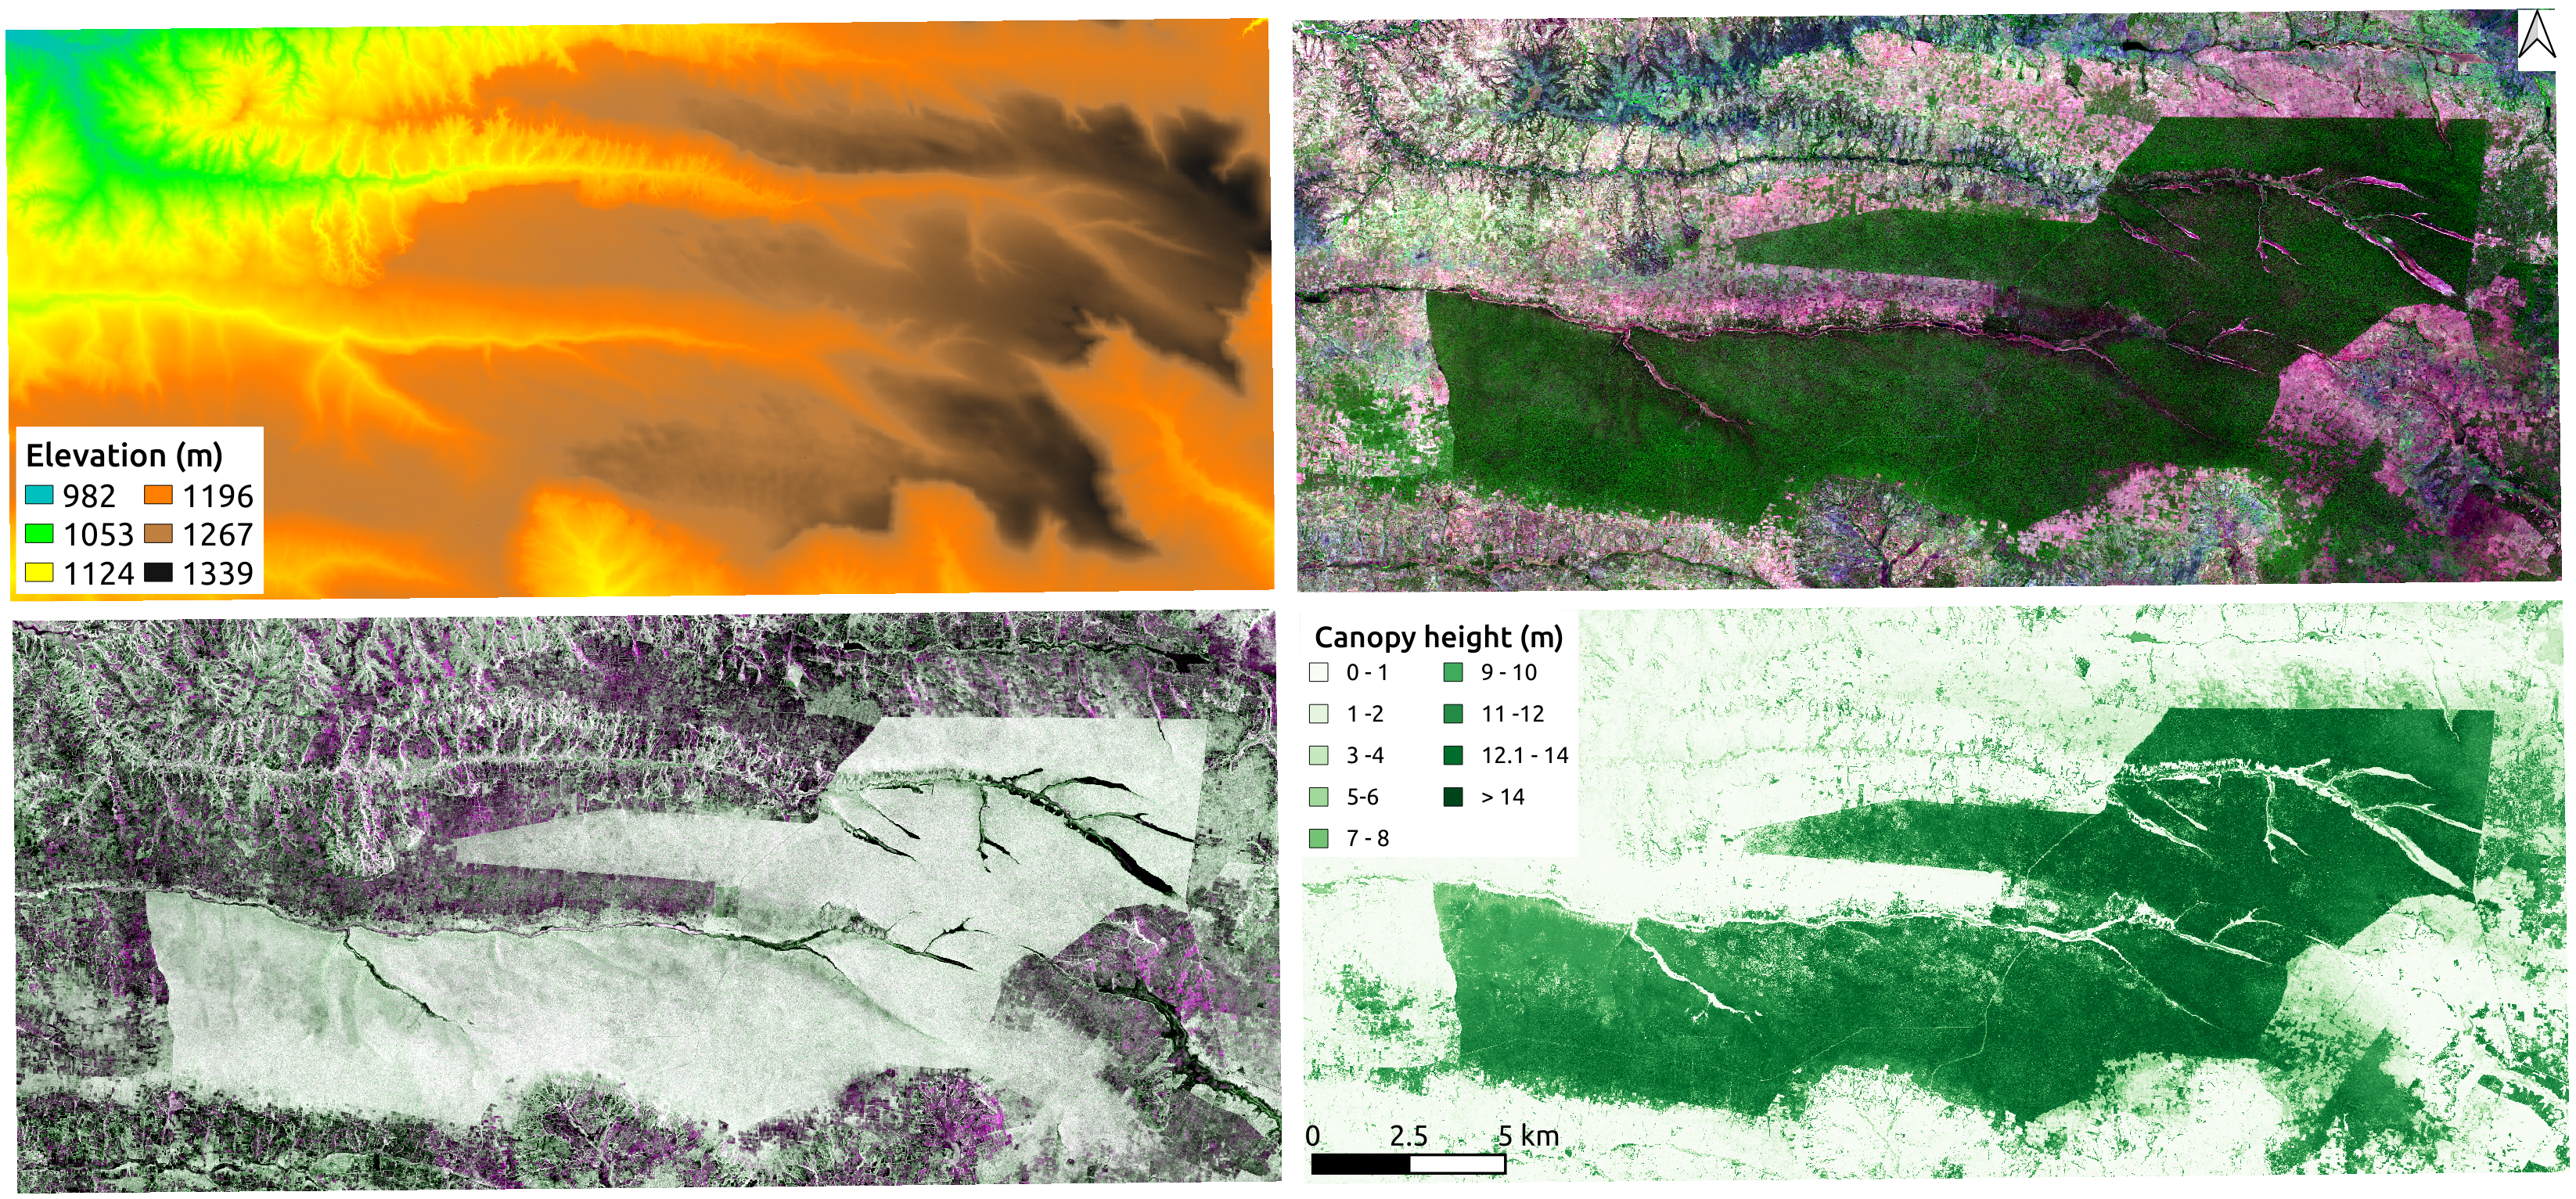
This blog tutorial will model forest canopy height using training data, dry season Sentinel-1, Sentinel-2, and elevation data in the RF model. We also use improved training data compiled from GEDI Level 3 (L3) gridded mean canopy height data.
Data and Procedure
In this post, we will use Mafungautsi Forest Reserve in Zimbabwe as a test site. Readers can access the blog tutorial and data in the links below.
Next Steps
My upcoming book is “Data-centric Explainable Machine Learning for Land Cover Classification: A Practical Guide in R.”
If you want to learn more about the book, please check the information at: