Introduction
Forest managers need accurate above-ground biomass (AGB) maps for forest conservation and ecosystem services programs in tropical regions. However, tropical forest structure (canopy cover, height) and carbon stocks are difficult to map due to spatial heterogeneity. In addition, spectral reflectance from Earth Observation (EO) sensors is usually saturated in dense tropical forests, contributing to high uncertainty in mapping carbon stock. The lack of accuracy in AGB maps impedes our ability to assess the impact of forest cover changes (deforestation and regrowth) on atmospheric CO2 concentrations.
Spaceborne LiDAR: Creating a New Frontier for Assessing Forest Ecosystem
Light Detection and Ranging (LiDAR) uses a laser to measure the distance between the ground and the sensor. Remote sensing and forestry researchers have been using airborne and ground-based LiDAR mapping systems to map forest canopy structure (height) and estimate forest AGB. These LiDAR mapping systems are helping researchers understand how much carbon forests are sequestering and the impacts of climate change on forests. Despite these benefits, there are some limitations. These include high data acquisition costs and accuracy issues caused by dense forest canopy cover.
Spaceborne LiDAR provides a three-dimensional (3D) perspective on mapping forest structures. The Global Ecosystem Dynamics Investigation (GEDI) system is currently acquiring LiDAR data at a footprint resolution of 25 m. Remote sensing and forestry researchers can use the GEDI LiDAR data together with ground plot and EO data (optical and SAR imagery) to get accurate canopy height and AGB measurements. The GEDI LiDAR data also provides valuable information about the forest structure so that researchers can better understand the forest ecosystem.
Purpose of the Blog Post
The previous blog modeled forest canopy height using dry season Sentinel-1 (S1), Sentinel-2 (S2), and elevation data. We also used the training data from GEDI Level 3 (L3) gridded mean canopy height data (within a 1 km x 1 km grid).
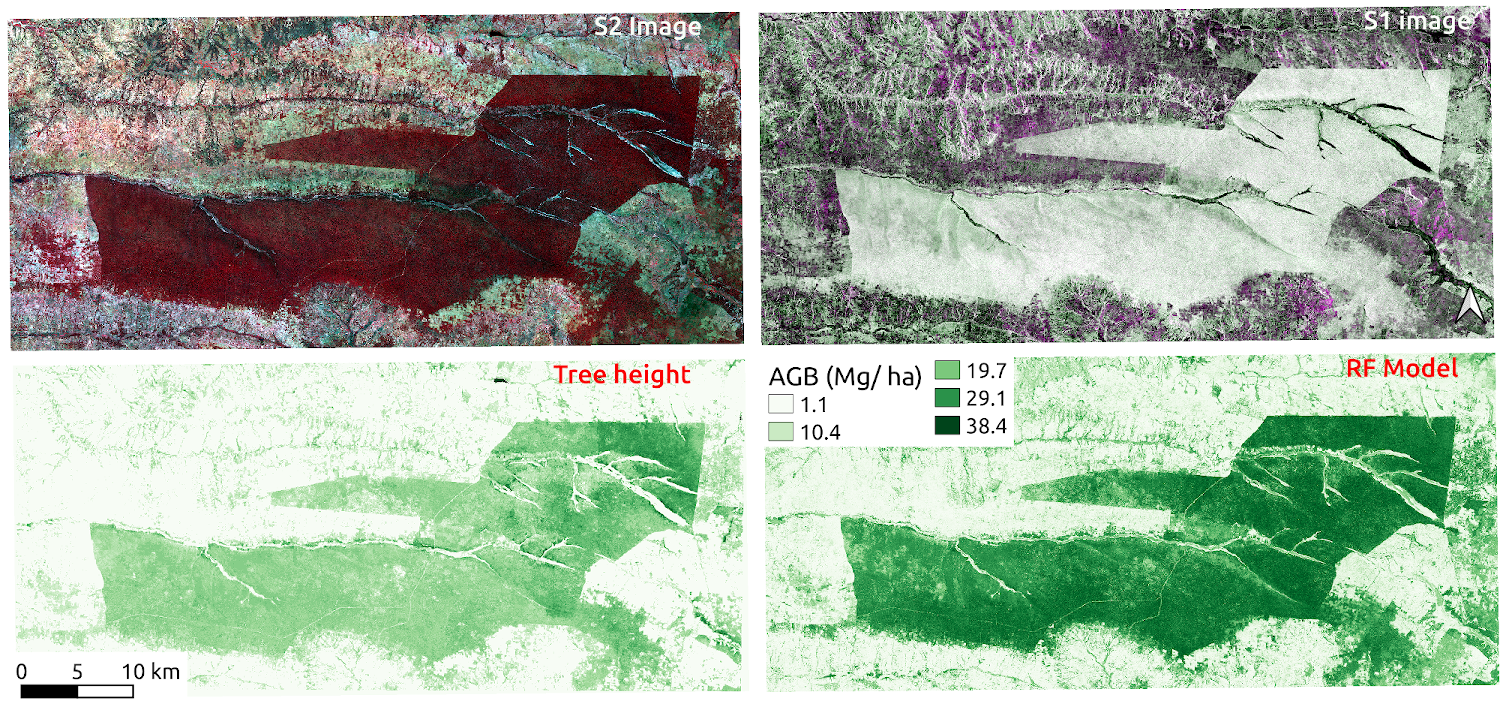
This blog tutorial will model forest canopy height using training data, post-rainy and dry season S1 and S2 data, normalized difference vegetation index (NDVI), and elevation data.
Data and Procedure
In this post, we will use Mafungautsi Forest Reserve in Zimbabwe as a test site. Readers can access the blog tutorial and data in the links below.
Next Steps
My upcoming book is “Data-centric Explainable Machine Learning for Land Cover Classification: A Practical Guide in R.”
If you want to learn more about the book, please check the information at: