Introduction
Forest researchers assess the status of the forest and woodland ecosystems by measuring different structural tree parameters such as tree canopy cover, tree height, and above-ground biomass (AGB). Over the past decades, climate change researchers and scientists have used forest AGB as a critical parameter to assess AGB carbon stocks. Therefore, the forest research community has focused much attention on acquiring reliable information on the spatial distribution of forest AGB over large areas. Spatially explicit forest AGB is required to understand the carbon cycle and support climate change mitigation and adaptation. In addition, spatially explicit forest AGB also provides vital information to implement sustainable forest management strategies at national, regional, and local scales. Earth observation (EO) and field-based plot inventory data can provide spatial forest AGB information at all scales.
Estimating forest AGB and uncertainties
The previous blog post stated that dealing with forest AGB estimation uncertainty (from field-based plot inventory and remote sensing methods) is quite challenging. Many researchers have used field-based plot inventory and remotely sensed data to map and estimate forest AGB. However, most researchers have frequently used the root mean square errors (RMSE) based on cross-validation or the mean AGB (for the whole study area) to assess uncertainty. Both these approaches are fraught with limitations. On the one hand, cross-validation provides optimistic estimates of the predictive power of the model. While the model may fit the training set data well, it is generally difficult to generalize to unseen test data. On the other hand, the mean AGB informs us how well the model is on average. However, researchers do not understand where the model performs well or why. Therefore, there is a need to use other methods to know how the model works or functions.
Purpose of the Blog Post
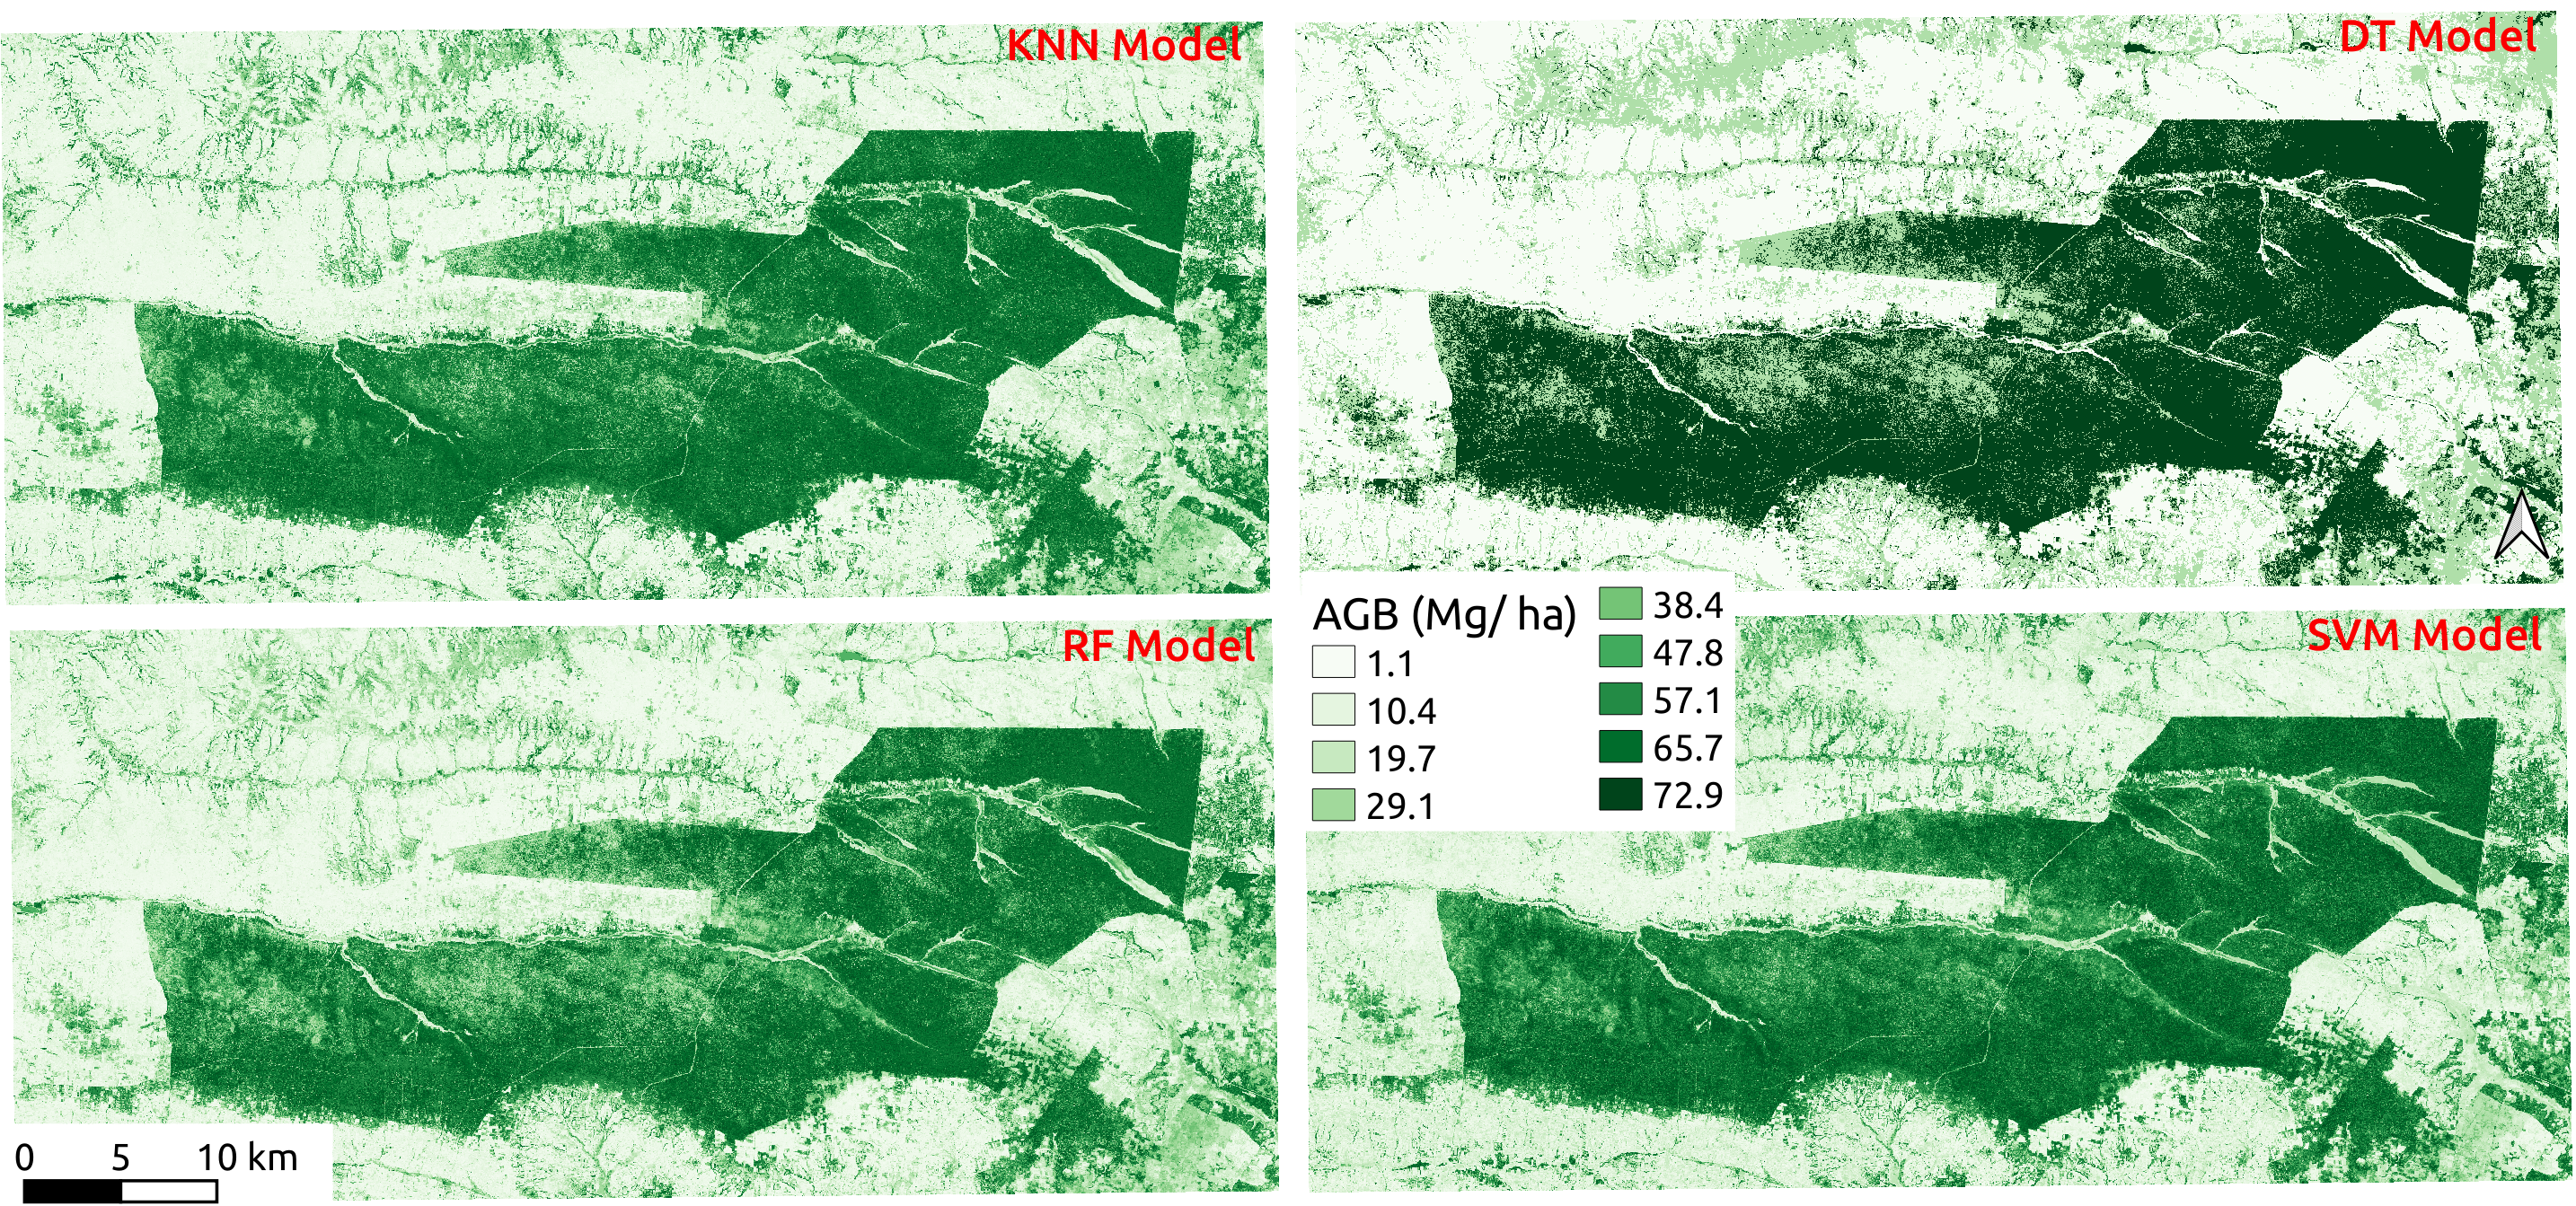
In the previous blog post, we trained a random forest (RF) model using forest AGB training data and Sentinel-1 and Sentinel-2 data. Following that, we performed uncertainty analysis based on cross-validation (CV) and explainable machine learning approaches. The cross-validation results revealed moderate model performance. However, the explainable machine learning showed poor model performance. This blog tutorial will model forest AGB using Sentinel-1 and Sentinel-2 data and four machine learning regression models. We will compare the performance of k-nearest neighbor (KNN), Classification And Regression Tree (also known as decision trees), random forests (RF), and support vector regression models.
Procedure
First, we will train the KNN, decision trees (DT), RF, and support vector regression models using forest AGB training data and Sentinel-1 and Sentinel-2 data. In this post, we will use Mafungautsi Forest Reserve in Zimbabwe as a test site. Readers can access the blog tutorial, sentinel-1 and sentinel-2, and training data in the links below.
Readers can also click the links below to check the AGB maps in Google Earth Engine and download the code.
Access the above-ground biomass App
Next Steps
I have prepared an introductory guide to perform explainable machine learning.

If you want to learn more about explainable machine learning, please download the guide for free at: