Introduction
Forest above-ground biomass (AGB) maps and carbon stock products are essential for forest management and climate change mitigation. The success of net-zero emission initiatives and the United Nations (UN) Reducing Emissions from Deforestation and Forest Degradation-plus (REDD+) programs depend on reliable and accurate forest AGB maps. Researchers have been using optical and SAR data to map forest AGB, particularly in tropical forest areas. High-quality forest AGB reference data are required both to produce accurate forest AGB maps and validate them. However, researchers face challenges in acquiring forest AGB reference data based on weighed tree biomass. Alternative approaches based on tree measurements (e.g., diameter, tree height) and allometric models include errors and uncertainties propagating into the final forest AGB maps.
Earth Observation (EO) Data for Mapping and Estimating biomass
The Challenges
Remote sensing researchers use ground-based estimates of biomass to calibrate and validate forest AGB maps. In general, remote sensing researchers assume that each sample field plot can be matched with the same area observed in remotely-sensed imagery. However, differences between field plot and pixel sizes, spatial co-registration errors, the temporal mismatch between field and remotely-sensed data, and the difference between the field-measured forest parameters (e.g., crown cover) and airborne/satellite signals introduce uncertainty.
The use of remotely-sensed data for mapping forest AGB is fraught with many challenges. For example, the penetrability of optical signals is weak in dense forests. As a result, the optical signals mainly record the horizontal structure of the forest. Therefore, optical sensors do not record the stem and branch biomass. Furthermore, remote sensing experts have observed that optical signals saturate differently even in a forest ecosystem with similar tree species. As a result, machine learning models fail to generalize well since the relationships between optical data and biomass vary significantly.
The SAR signals can penetrate the forest canopy for a specific microwave wavelength and record the vertical structure information. For example, longer SAR wavelengths (L-band and P-band) are better than short wavelengths (X-band and C-band) to map biomass in tropical forest areas. While L- and P-bands have high penetration ability, the SAR signal is susceptible to saturation in high canopy density and biomass areas. Saturation problems decrease the accuracy of extracting essential forest structure parameters.
The Opportunities
The effort to minimize the uncertainty between ground and remotely sensed data is an opportunity to improve remote sensing-based biomass approaches. Recently, remote sensing researchers have used airborne lidar to measure forest canopy height, forest cover, and vertical structure. Airborne lidar measures tree height using laser-based ranging, which is better than field techniques. However, airborne lidar is relatively expensive, particularly in developing countries. New technological developments such as Terrestrial Laser Scanning (TLS) and Unmanned Aerial Vehicle (UAV) platforms can help collect reliable field plot data at different scales.
In addition, several current and upcoming missions such as the National Aeronautics and Space Agency’s Global Ecosystem Dynamics Investigation (GEDI), the NASA/Indian Space Research Organization’s NASA-ISRO Synthetic Aperture Radar (NISAR), the European Space Agency’s BIOMASS, and the Japan Aerospace Exploration Agency’s Advanced Land Observing Satellite (ALOS-4) will provide reliable data on forest structure and conditions. Researchers and scientists will improve the mapping of forest AGB using data (derived from these sensors) and data-centric machine learning methods that are transparent and flexible.
Purpose of the Blog Post
In the previous blog post, we trained forest AGB using Sentinel-1 and Sentinel-2 data and four machine learning regression models. We compared the performance of k-nearest neighbor, Classification And Regression Tree (also known as decision trees), random forests (RF), and support vector regression models. Following that, we performed uncertainty analysis based on cross-validation (CV) and explainable machine learning approaches. The cross-validation results revealed that the RF model had the best model performance. However, the explainable machine learning showed that all the models had poor performance due to insufficient training data and the Sentinel-1 and Sentinel-2 data saturation.
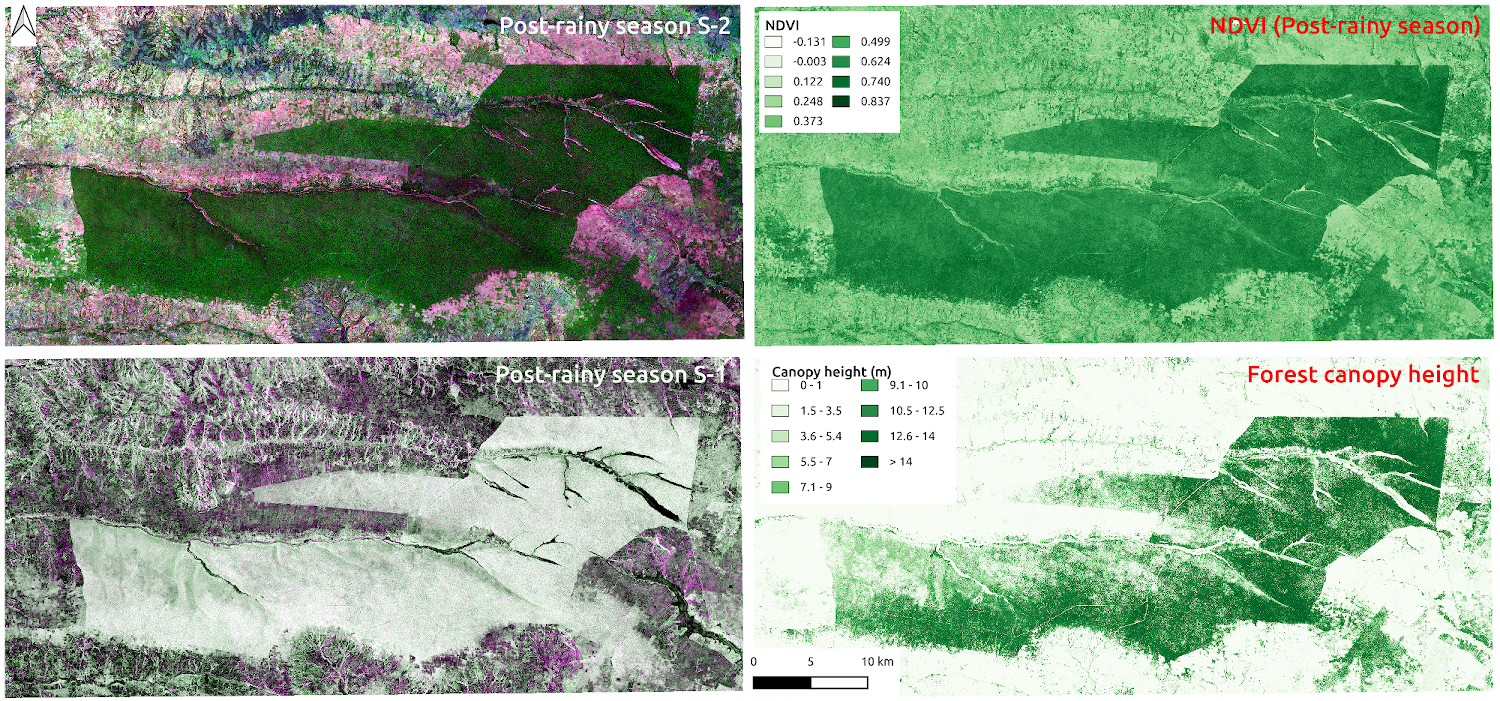
This blog tutorial will model forest AGB using a random forest (RF) model. We will use an improved forest AGB training data set, Sentinel-1 and Sentinel-2 data, normalized difference vegetation index (NDVI), and the Global Land Analysis and Discovery (GLAD) tree height data.
Data and Procedure
In this post, we will use Mafungautsi Forest Reserve in Zimbabwe as a test site. Readers can access the blog tutorial and data in the links below.
Readers can also click the links below to check the AGB map in Google Earth Engine and download the code.
Next Steps
I have prepared an introductory guide to perform explainable machine learning.

If you want to learn more about explainable machine learning, please download the guide for free at: