
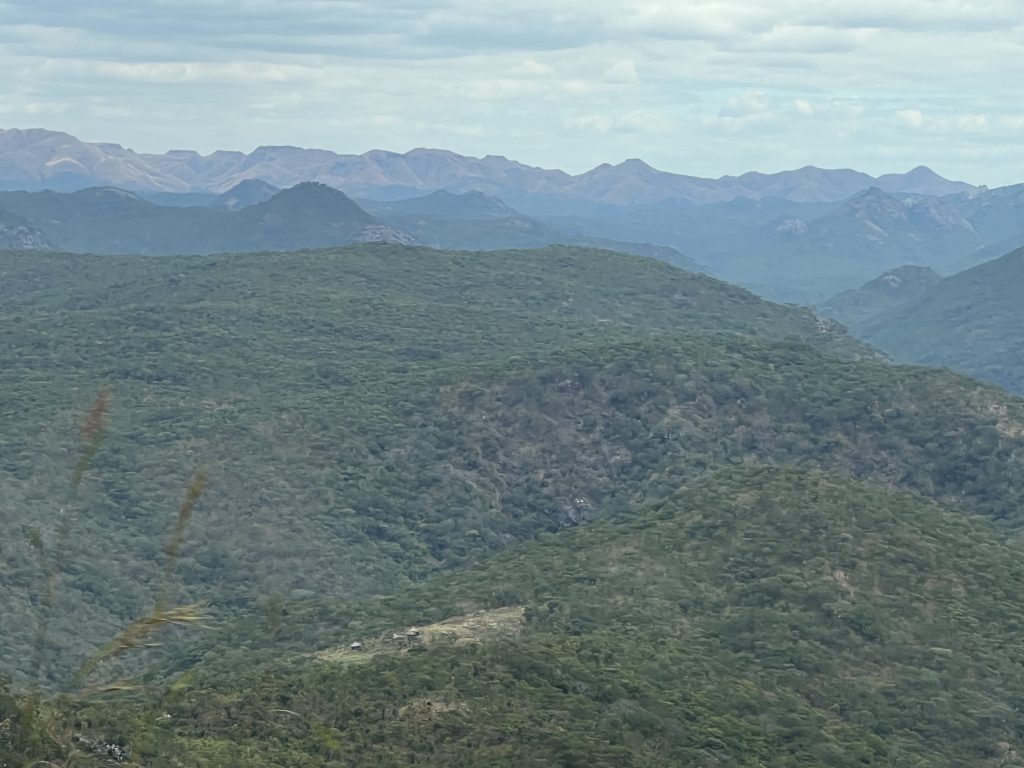
Africa’s woodlands are vanishing one tree at a time in ways satellites often miss, and carbon accounting systems rarely detect. But this is not just a technology problem. It may also be a thinking problem. Have we been measuring the wrong structural signals all along? Until we rethink both how we monitor forest carbon and what we choose to measure, our policies will continue to overlook the slow degradation reshaping Africa’s woodlands.
Introduction
Each year, millions are spent on climate policies to protect tropical forests. These efforts depend on satellite imagery, carbon inventories, and deforestation maps from governments and organizations such as the UN FAO. But even with advanced monitoring, many systems still measure the wrong thing.
Southern Africa is home to one of the world’s most densely populated and ecologically important woodland regions. Yet the dominant form of forest loss is often invisible on conventional satellite-based forest maps. This is because the slow degradation reshaping these woodlands is often difficult to detect on satellite imagery. It is not always a field cleared for agriculture or a logging road cutting through the canopy. Instead, it is a quieter and more difficult process to measure. That is, the gradual thinning of trees caused by fuelwood harvesting, selective timber extraction, and repeated low-intensity fires. The woodland still appears intact, but much of its carbon has already been lost.
The distinction between deforestation and degradation is more than a technical classification. Deforestation removes the forest entirely. Degradation leaves the forest standing while steadily eroding its biomass and carbon stocks. Yet global climate and carbon accounting systems tend to prioritize the first problem, while the second remains poorly measured and largely overlooked.
Recent science suggests the measurement failure goes deeper. We have not only used the wrong instruments but also asked the wrong structural questions. Tracking total biomass, as most systems do, hides the different ways forests are lost. Understanding degradation requires separating the number of trees from their size. These are distinct signals driven by different human pressures, requiring distinct policy responses. Current monitoring systems rarely make this distinction.
The Optical EO Blind Spot
To understand why degradation frequently escapes detection, we must first see how Earth observation (EO) systems monitor African woodlands and their limitations in detecting subtle forest change.
Most forest monitoring systems rely heavily on optical satellite data, where EO sensors measure sunlight reflected from the Earth’s surface. Southern African woodlands are not simple closed-canopy forests. They are structurally complex and seasonally dynamic ecosystems, with discontinuous tree cover above a persistent grass layer. Leaf cover expands rapidly during the wet season and drops during the dry season. As a result, selective logging, fuelwood harvesting, and removal of understory trees often produce only subtle changes in the optical signal. The canopy regenerates, grasses green up after rainfall, and the satellite continues to classify the area as ‘forest.’
Seasonal fires make this worse. Burn scars change the spectral signature of the landscape so much that classifying what you see becomes little more than informed guesswork. I know this from direct experience.
FROM THE FIELD — 2002
When I started working in remote sensing image analysis in 2002, I was producing a land cover map from a Landsat ETM+ mosaic of two scenes acquired in September and October (dry season in Southern Africa). Back then, ordering and finding cloud-free imagery from the USGS alone could take weeks. Multi-season coverage was a luxury most of us could not access.
For training data, I relied on black-and-white aerial photographs from 1996 at a scale of 1:25,000, interpreting land cover classes by eye. After preparing the classification, I went into the field to verify the results.
It fell apart almost immediately. Some Miombo woodland areas were missed entirely. Others were underestimated. Some were misclassified because the trees had shed their leaves, and to Landsat, a leafless Miombo woodland looked like something else entirely. Seasonal fires further altered the spectral signature. I had produced a confident-looking map of a landscape I fundamentally misunderstood.
We had no Google Earth, no anniversary high-resolution imagery, and no near-real-time platforms. We worked with Landsat, limited reference data, and the hard lesson that a satellite image is not ground truth but a hypothesis about the landscape waiting to be tested.
That lesson points to a fundamental limitation in many carbon maps shaping climate policy globally. Many forest monitoring systems used across Africa, including those informing national inventories and international carbon accounting frameworks, remain heavily focused on optical remote sensing and land-cover change detection. As a result, they are generally far more effective at identifying outright deforestation than at identifying the gradual, spatially diffuse degradation caused by fuelwood harvesting, selective logging, and recurrent fire. Predictably, what they fail to measure is often what disappears.
Global carbon accounting framework!
The result is a global carbon accounting framework that systematically undercounts carbon loss across African woodlands. This is not a failure of scientific integrity but a limitation of the monitoring systems. Optical EO sensors are highly effective at detecting deforestation but far less capable of capturing gradual, low-intensity woodland degradation.
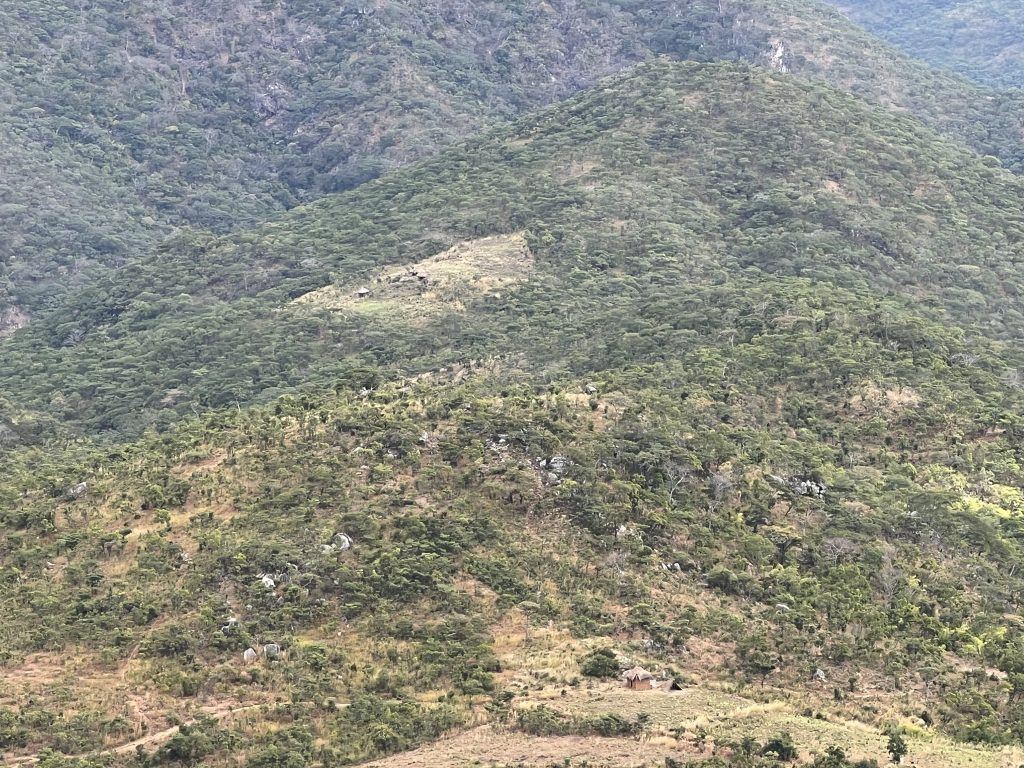
Mavuradonha Wilderness area.
The Wrong Structural Question
Most forest carbon monitoring systems, whether optical or radar-based, reduce forests to a single number, aboveground biomass density (AGBD), expressed in tonnes per hectare. The problem is that this number does not reveal the structure of the biomass. A woodland with many small stems can produce a similar AGBD value to one with fewer large trees. Yet these landscapes behave very differently under degradation and recovery. AGBD is shaped by two distinct components, stem density and mean stem biomass. When monitoring systems collapse into a single metric, important forms of woodland change can become difficult to detect.
Consider what happens when a woodland is selectively logged for high-value timber. Large, commercially valuable trees are removed. AGBD declines substantially because large trees hold most of the biomass, yet stem density changes little because dozens of smaller trees remain standing. A monitoring system tracking only total biomass will record some loss. But a system that tracks only the canopy signal or relies on relationships calibrated to stem density will likely underestimate the amount of carbon removed, because the number of stems has not changed much. The forest still looks structurally intact. The carbon is not there.
The reverse also occurs. When a degraded woodland begins to recover through post-cultivation regrowth, new stems emerge rapidly. Stem density increases, and radar backscatter responds accordingly, but the mean biomass per stem remains low. A system reading total biomass from radar intensity alone could overestimate the rate of genuine carbon recovery because it detects the number of new small stems rather than the accumulation of substantial woody mass in larger trees.
NEW RESEARCH
A major new study published in Remote Sensing of Environment by Carreiras et al. provides the first large-scale, multi-continental empirical analysis of how L-band SAR backscatter responds to woodland structure in dry tropical ecosystems. The study used 221 ground plots across Africa, Australia, and South America with fully polarimetric ALOS PALSAR data.
The study’s central finding challenges a key assumption in biomass monitoring. It shows that the L-band radar signal responds primarily to stem density, or the number of trees per hectare, rather than mean stem biomass. Using structural equation modeling, the authors found that the effect of stem density on volume scattering, the dominant radar signal in wooded areas, is more than twice as strong as the effect of mean stem biomass.
In practice, radar-based AGBD maps may show little change when biomass is lost through the removal of large trees, because stem numbers remain largely unchanged. At the same time, the radar signal may respond strongly to increases in small regenerating stems, even when those stems contain little woody biomass.
This finding has a direct implication for how degradation is understood in practice. Selective logging, which involves the removal of large, high-value stems, is precisely the form of degradation that changes mean stem biomass far more than stem density. It is also one of the most commercially driven and economically significant forms of woodland loss across Southern Africa. A monitoring framework built solely on radar intensity, without separating stem density from mean stem biomass, will systematically undercount this form of carbon loss. The instrument is better than optical imagery, but it is still asking the wrong question.
What the SAR Sees That Optics Cannot
Despite these limitations, the shift to L-band radar has already substantially changed what we know about carbon loss across Southern African woodlands. Research using L-band radar data from Japan’s ALOS PALSAR satellite produced carbon maps at 25-meter resolution (McNicol et al., 2018). Unlike optical sensors, which detect reflected sunlight and are heavily influenced by seasonal leaf cover and grasses, radar sensors respond to vegetation’s physical structure. It penetrates the canopy and is far less sensitive to seasonal changes in greenness.
What these SAR-based carbon maps reveal is striking. The maps show that degradation, not deforestation, is the principal source of carbon loss across Southern African woodlands. Degradation affected 17% of wooded areas and accounted for more than half of the region’s biomass loss. Carbon losses from gradual woodland thinning were roughly twice those from outright forest clearing. This is not a minor correction to existing estimates. It suggests that the carbon losses most climate policies are designed to prevent may represent only part of the real problem.
Mavuradonha Wilderness — Sentinel-2 vs ALOS-2 PALSAR-2
Drag the divider to compare · Toggle layers inside the map
Loading Earth Engine map…
A Stable Headline, An Unstable Reality
One result from this research needs to be interpreted carefully, as it could be misunderstood. Overall, aboveground carbon stocks in the region seem stable during the study period. Losses in some areas are partly offset by gains in recovering remote woodlands. These gains probably result from regrowth after cultivation, higher atmospheric CO₂ levels, and reduced pressure from large herbivores.
However, this stability should not reassure us. While the region as a whole appears stable, serious instability persists locally. Woodlands near cities, which over 150 million people rely on for fuel, timber, and other resources, are quickly degrading. Meanwhile, most carbon recovery occurs in remote areas far from these communities. A stable carbon balance in reports can still hide a growing ecological and humanitarian crisis.
The findings from Carreiras et al. (2026) add another layer to this instability. In many remote areas, carbon recovery often occurs because many small trees grow quickly after the land is no longer farmed. Since L-band radar detects stem density, it might exaggerate how fast and how much real carbon recovery is occurring. The amount of biomass is measured, but its quality is not. A woodland with ten thousand small trees is not the same, ecologically, as one with a thousand large trees, even if their aboveground biomass numbers are similar.
This leads to a difficult policy issue. If climate programs focus only on total carbon stability, they might end up rewarding natural recovery in remote areas while ignoring woodlands near people that are being lost one tree at a time.
The Policy Blind Spot
REDD+, the UN’s main program for reducing emissions from deforestation and forest degradation, clearly includes degradation in its goals. However, most forest monitoring systems in Africa still focus mostly on deforestation. This is not because of a lack of effort or missing satellite data. Landsat and Sentinel satellite images have been free to use for years, and radar data is now easier to get. The real challenge is that it is technically difficult to detect and measure degradation at scale.
The study by Carreiras and colleagues helps explain why this problem continues, even with radar-based systems. To spot degradation caused by selective logging, we need to distinguish between a drop in average stem biomass and no change in the number of stems. Aggregate AGBD maps cannot do this. To see recovery, we have to separate real biomass growth in older stems from the increase in many new small ones that radar can detect. Standard dual-polarisation radar intensity data alone cannot make either distinction.
If something is not measured, it is rarely funded or protected. Woodlands that slowly disappear due to fuelwood harvesting, selective logging, or repeated fires generate few carbon credits and receive little policy attention. The communities that rely on these woodlands get little help or motivation to manage them well. The policies and funding tools are already in place. But until monitoring systems can show how biomass is changing, not just if it is, the accounting will always be incomplete.
This is what makes the double measurement problem so important. It is more than just a technical issue about sensors or data. The real question is whether climate finance reaches the places and communities where carbon loss actually happens. It also depends on whether funding systems notice the right types of loss when they do.
What Would Change If We Measured Correctly
A carbon accounting system built around the full structural information provided by fully polarimetric radar would produce a very different picture of carbon loss across African woodlands. This contrasts with current approaches that rely mainly on optical deforestation detection or single-variable AGBD intensity mapping.
Carreiras et al.(2026) demonstrate that full polarimetric L-band SAR data, when decomposed into volume, surface, and double-bounce components, enable the structural equation model to be inverted to retrieve both stem density and mean stem biomass separately. This is the measurement advance the field has been waiting for. Selective logging reduces mean stem biomass without greatly changing stem density. Recovery behaves differently. It increases stem density before large amounts of stem biomass have accumulated. Carbon accounting can begin to track not just how much biomass is present, but also what kind of biomass and which process is driving change.
This approach would let us measure the carbon stored in degraded woodlands near cities in the carbon economy, capturing losses that are currently overlooked. Communities that collect fuelwood or selectively log trees would be recognized as sources of specific, measurable carbon loss. Instead of being seen only as residents of seemingly stable landscapes, their impact would be clear. As a result, climate policies and investments could focus on peri-urban woodlands, where ecological stress is highest, and people rely most on these resources.
The technical tools for this work are already available. We have full polarimetric L-band data from ALOS-2 PALSAR-2 and the new ALOS-4 PALSAR-3 satellites. The upcoming ESA BIOMASS mission and ROSE-L will add even more options. Carreiras et al. point out that their modeling method works with any radar frequency, so it will also fit with P-band data from BIOMASS. The real gap is not in satellite data, but in building the institutional capacity, technical skills, field calibration networks, and policy support needed to use these methods in Africa’s forest monitoring and carbon accounting systems.
For years, the gradual thinning of African woodlands has mostly gone unnoticed because most monitoring systems were designed to spot clear-cutting, not slow declines in biomass. Even when using radar that can detect biomass, we often focus on a single overall number, missing important details beneath the surface. We paid attention to how green the canopy looked, but the real changes were happening in the woodland’s structure. We measured total biomass, but the key questions were about the number and size of trees. While the woodlands changed, our monitoring systems did not fully capture it. As a result, policies based on these systems have underestimated both the extent and nature of what is being lost.
Building the Next Generation of Forest Carbon Monitoring Capacity
Closing this measurement gap requires more than improved satellite data. It requires a new generation of technical capacity across government agencies, research institutions, NGOs, carbon project developers, and environmental consulting organizations in Africa.
At AI.Geolabs, we develop practical training programs focused on radar remote sensing, Earth observation, biomass and carbon modeling, machine learning, cloud computing, and explainable GeoAI for forest and environmental monitoring. Our goal is to help organizations move beyond conventional land cover mapping toward operational systems that detect woodland degradation, quantify biomass change, and support more accurate carbon accounting and climate policy.
These programs are designed for practitioners working in forestry, REDD+, climate finance, biodiversity monitoring, ESG reporting, and natural resource management. The focus is on practical, applied work in real African woodland and savanna systems, using modern Earth observation workflows and openly accessible satellite datasets.
If African woodland degradation is to be measured accurately, financed effectively, and managed sustainably, institutions will need both the technology and the expertise to do so. The satellites are already in orbit. The next challenge is building the human capacity to use them properly.
References
Carreiras, J. M. B., Higginbottom, T., Godlee, J. L., Harrison, S., Benitez, L., Mograbi, P. J., Levesley, A., Melgaço, K., Milodowski, D., Pickavance, G., Wells, G., de Oliveira, E. A., Arroyo, L., Bowers, S., Brienen, R. J. W., Cardoso, D., Castro, A. A. J. F., Chavez, E., Coutinho, Í. A. C., . . . Muchawona, A. C. (2026). Determinants of L-band backscatter in dry tropical ecosystems: Implications for biomass mapping. Remote Sensing of Environment, 334, 115213
McNicol, I. M., Ryan, C. M., & Mitchard, E. T. A. (2018). Carbon losses from deforestation and widespread degradation offset by extensive growth in African woodlands. Nature Communications, 9(1), 3045